Monitoring
Maptrics is an innovative SaaS platform designed to proactively identify and resolve critical SEO issues before they impact your website's search engine rankings. It provides a clear health score, detects broken meta descriptions and titles, and offers AI-powered explanations for traffic changes in plain language, helping site owners avoid costly traffic drops without requiring any coding knowledge.This tool is ideal for developers, designers, marketers, and any website owner looking to maintain or improve their site's SEO health and performance.Key Features:SEO Health Score: Get an instant overview of your website's SEO status.AI Analysis: Understand the root cause of traffic changes with plain-language explanations and actionable recommendations.Deploy Notifications: Receive alerts immediately after a deployment if new SEO issues are introduced.Rankings & Traffic Monitoring: Connect with Google Search Console to track performance.Meta & Titles Monitoring: Automatically detect broken or altered meta descriptions and titles.Structured Data Validation: Ensure your structured data is correctly implemented.Use Cases:Maptrics is invaluable for teams and individuals who want to safeguard their website's organic traffic. For instance, a development team can integrate Maptrics with their Vercel deployment pipeline to automatically scan for SEO regressions post-deploy. If a deploy accidentally removes meta descriptions or alters canonical URLs, Maptrics will flag these issues immediately, preventing potential ranking drops before Google's next crawl.Marketers can leverage Maptrics to quickly diagnose unexpected traffic fluctuations. Instead of spending hours manually investigating, they can ask Maptrics in plain language, "Why did our blog traffic drop after the last deploy?" and receive an AI-generated explanation, such as "The deploy removed noindex meta tags from 34 staging URLs, causing duplicate content issues." This allows for rapid problem identification and resolution, ensuring continuous SEO performance.Pricing Information:Maptrics offers a freemium model, providing a "Free forever for small sites" option. Users can try the demo without a credit card and cancel their subscription at any time, making it accessible for various budgets and project sizes.User Experience and Support:Designed for ease of use, Maptrics boasts a "5-minute setup" process. Users simply add their sitemap, and the platform automatically discovers pages and fetches data without requiring any code. Its intuitive interface and "no code required" approach make it accessible to non-technical users, while its integration capabilities (e.g., Vercel webhooks, Google Search Console) cater to more technical workflows. While specific support channels aren't detailed, the product's design emphasizes self-service and clear, actionable insights.Technical Details:Maptrics operates as a web-based SaaS, integrating with external services like sitemaps (XML), Google Search Console for ranking data, and deployment webhooks (e.g., Vercel) for real-time monitoring. It crawls web pages to extract critical SEO elements such as titles, meta tags, OG tags, and structured data, providing a comprehensive overview of a site's SEO health.Pros and Cons:Pros:Catches SEO issues proactively before Google detects them.Requires no coding knowledge for setup or use.Provides AI-powered, plain-language explanations for traffic changes.Offers real-time deploy notifications to prevent regressions.Quick and easy 5-minute setup.Freemium model with a free option for small sites.Cons:Specific integrations mentioned are limited (Vercel, with "more coming soon").No explicit mention of advanced customization options.Detailed support channels are not specified in the provided text.Conclusion:Maptrics empowers website owners and teams to maintain optimal SEO health effortlessly, preventing traffic drops and ensuring continuous online visibility. Its proactive monitoring, AI-driven insights, and user-friendly design make it an essential tool for anyone serious about their website's search performance. Try the demo today to experience how Maptrics can transform your SEO workflow.
Overview The website quan1229.com is currently inaccessible, displaying an HTTP 502 Bad Gateway error. This indicates a server-side issue where the server acting as a gateway or proxy received an invalid response from an upstream server. As a result, no information regarding the specific SaaS product, its primary purpose, or target audience can be provided at this time. Key Features Due to the website's unavailability, no features of the SaaS product hosted at quan1229.com can be identified or described. Use Cases Without access to the website or any descriptive content, specific use cases for this SaaS remain unknown. We are unable to explain how it solves common problems or improves workflows. Pricing Information Pricing models, free trials, freemium options, or money-back guarantees for quan1229.com's SaaS product are currently unavailable due to the website error. User Experience and Support Information regarding the user interface, ease of use, documentation, tutorials, or support options cannot be assessed while the website is experiencing an HTTP 502 error. Technical Details Details about the programming languages, frameworks, or technologies used by quan1229.com's SaaS product are not available from the provided error message. Pros and Cons As the website is not functioning, it is impossible to list advantages or potential challenges associated with using this product. Conclusion The current status of quan1229.com prevents any evaluation of its SaaS offering. We recommend checking back later once the technical issues are resolved to explore its potential value proposition and functionality.

Introduction FrogDR is a dedicated SaaS platform designed to help businesses and individuals monitor, track, and improve their Domain Rating (DR). It provides essential tools for SEO professionals, website owners, and digital marketers aiming to enhance their online presence and search engine visibility. Key Features Track Domain Rating progress over time for multiple websites in one dashboard. Receive automated notifications when your DR changes. Access advanced monitoring features including backlinks and referring domains. Benefit from unlimited on-demand DR updates. Engage with a leaderboard, set goals, and celebrate milestones for motivation. Opportunity to acquire do-follow backlinks. Use Cases FrogDR is invaluable for anyone focused on search engine optimization and website authority. SEO agencies can use it to manage and report on client website performance, ensuring continuous improvement in DR. Small business owners can leverage the platform to understand their website's standing against competitors and identify opportunities for growth by tracking their DR and acquiring quality backlinks. Furthermore, content creators and bloggers can utilize FrogDR to monitor the impact of their content strategies on their domain authority. By setting goals and tracking milestones, they can stay motivated and strategically work towards improving their website's credibility and organic search rankings, ultimately driving more traffic and engagement. The platform is already monitoring over 12,000 websites, demonstrating its widespread adoption. Pricing Information FrogDR operates on a freemium model. Users can sign up for free to access basic monitoring features and track their progress. For more advanced capabilities, such as detailed backlinks & referring domains analysis, unlimited on-demand DR updates, and participation in the leaderboard, an "Advanced Monitoring" plan is available for $5/month. User Experience and Support The platform emphasizes ease of use with a clear call to action: "Sign up, it's free!" and "Let's check your DR now!". The mention of "Monitor all your websites in one dashboard" suggests a centralized and user-friendly interface designed for efficient management. While specific details on documentation or direct support channels are not provided, the straightforward nature of the service implies a focus on accessibility for its users. Technical Details The provided information does not specify the programming languages, frameworks, or underlying technologies used by FrogDR. However, as a web-based SaaS platform, it is built to be accessible through standard web browsers, indicating a robust web application architecture focused on delivering real-time domain rating insights. Pros and Cons Pros: Free entry point allows users to test the service. Comprehensive DR monitoring with historical tracking. Automated notifications for DR changes keep users informed. Advanced features like backlink analysis are crucial for SEO. Motivational tools like leaderboards and goal setting. Opportunity to gain do-follow backlinks. Cons: Specific details on support and documentation are not explicitly mentioned. The full extent of "advanced monitoring" features beyond backlinks is not fully detailed. No explicit mention of a free trial for the paid plan, only a free tier. Conclusion FrogDR offers a compelling solution for anyone serious about improving their website's Domain Rating and overall SEO performance. With its intuitive monitoring tools, advanced features, and motivational elements, it empowers users to track progress and achieve their digital marketing goals. Click here to get started and elevate your website's authority today!

FrogDR is a dedicated SaaS platform designed to help website owners and SEO professionals monitor their domain's SEO performance. It provides a centralized dashboard to track crucial metrics like Domain Rating (DR) and Domain Authority (DA) across multiple websites, ensuring users stay informed about their online presence. Key Features Comprehensive Domain Rating (DR) and Domain Authority (DA) tracking. Centralized dashboard for monitoring multiple websites. Automated notifications for changes in Domain Rating. Detailed insights into backlinks, keywords, and organic traffic. Weekly email updates on domain data. Homepage Authority (PA) and URL Rating (UR) metrics. Use Cases FrogDR is ideal for digital marketing agencies managing multiple client websites, individual webmasters keen on improving their site's SEO, and businesses looking to benchmark their domain strength against competitors. It simplifies the complex task of SEO monitoring by consolidating key performance indicators into one accessible platform. Users can leverage FrogDR to quickly identify drops in domain authority, track the impact of link-building campaigns, and understand their organic search visibility. This proactive monitoring allows for timely adjustments to SEO strategies, helping to maintain and improve search engine rankings and overall website health. Pricing Information While specific pricing tiers are not detailed, FrogDR operates as a monitoring service, suggesting a subscription-based model. Users are encouraged to "Start Monitoring," implying a paid service for comprehensive tracking and notifications. A subscription option for weekly email updates is also available. User Experience and Support The platform emphasizes ease of use with its promise to "Track your progress" and "Monitor all your websites in one dashboard," indicating an intuitive user interface. The notification system ensures users are promptly alerted to significant changes, streamlining the monitoring process. Further details on documentation or direct support channels are not explicitly provided. Technical Details No specific programming languages, frameworks, or underlying technologies are mentioned in the provided content. Pros and Cons Pros: Centralized SEO monitoring, automated DR change notifications, comprehensive metric tracking (DR, DA, backlinks, traffic, keywords), weekly data updates. Cons: Specific pricing not detailed, no explicit mention of technical stack, limited information on direct customer support or documentation. Conclusion FrogDR offers a valuable solution for anyone serious about tracking and improving their website's SEO performance. By providing a clear overview of critical domain metrics and proactive alerts, it empowers users to make informed decisions and maintain a strong online presence. Explore FrogDR today to gain better control over your domain's authority and search engine visibility.
BoxWatch is a comprehensive, cost-effective server monitoring SaaS designed for developers and teams. It provides essential CPU, memory, disk, and network metrics with a simple one-command installation, helping users watch their boxes and sleep at night. Key Features 60-Second Setup: Install the agent with a single curl command, no complex YAML configs. Multi-Region Uptime Monitoring: Probe HTTP endpoints, TCP ports, and TLS cert expiry from your existing agents, enabling internal network checks. Process Monitoring: Track CPU, memory, and uptime for specific processes like Nginx or Postgres, with alerts for anomalies. Cron Heartbeat Monitoring: Ensure scheduled jobs run on time and successfully with simple ping URLs, supporting various cron systems. Disk Full Prediction: AI-powered forecasting alerts you days before disk space runs out, using linear regression on historical data. Cost-Effective: Offers similar metrics to alternatives like Datadog at a significantly lower cost (e.g., $13/mo vs $375/mo for 25 servers). Use Cases BoxWatch is ideal for developers and system administrators who need reliable, real-time insights into their server infrastructure without breaking the bank. It's perfect for monitoring web servers, database instances, and cache servers, providing immediate alerts via Slack, Discord, or webhooks when critical thresholds are exceeded or services go offline. Teams can leverage its multi-region probing capabilities to verify internal network services are reachable from different parts of their infrastructure, a crucial feature for distributed systems. Furthermore, BoxWatch simplifies the management of scheduled tasks and critical processes. Users can set up cron heartbeat monitoring to ensure their backups, data processing jobs, or reporting scripts execute as expected, receiving instant notifications for failures or delays. Process monitoring allows for granular control over resource-intensive applications, preventing performance bottlenecks and ensuring application stability. The disk prediction feature proactively addresses potential storage issues, saving countless hours of reactive troubleshooting. Pricing Information BoxWatch offers a simple, predictable pricing model with no per-metric charges or surprise bills. It includes a "Hobby" freemium plan that is free forever, supporting 5 servers, 1 alert rule, and 24-hour data retention. Paid plans ("Pro", "Team", "Scale") offer increased server limits, more alert rules, longer data retention, and advanced features, starting from $13/month. A free trial is available for paid plans. User Experience and Support The platform emphasizes ease of use with its "60-Second Setup" via a single curl command. The dashboard provides clear, at-a-glance server status, CPU, memory, and disk usage. Alerts are highly customizable and can be sent to popular team communication tools like Slack and Discord, or via webhooks and email. Comprehensive documentation is available through its "Docs" and "FAQ" sections, ensuring users can quickly find answers and optimize their monitoring setup. Technical Details The core of BoxWatch's monitoring is a lightweight, open-source bash script agent. This agent runs via cron on Linux servers, collecting system performance metrics (CPU, memory, disk, network) and securely sending them to the BoxWatch API. The open-source nature of the agent allows users to verify exactly what data is collected, ensuring privacy and transparency. Pros and Cons Pros: Highly cost-effective compared to alternatives; extremely easy and fast setup; open-source agent for transparency; comprehensive features including multi-region probes and disk prediction; privacy-first approach; flexible alerting options. Cons: Some advanced features (process monitoring, agent-based uptime checks) are Linux-only; data retention is limited on lower-tier plans; no explicit mention of Windows server support. Conclusion BoxWatch delivers powerful, yet affordable, server monitoring capabilities with an emphasis on simplicity and transparency. Its robust feature set, including proactive alerts and unique multi-region probing, makes it an invaluable tool for any team looking to maintain high server availability and performance without incurring excessive costs. Start monitoring your servers for free today and experience the peace of mind BoxWatch provides.
Visual Sentinel is a comprehensive website monitoring SaaS designed to catch issues that traditional uptime tools miss. It provides a holistic view of website health by checking uptime, SSL, DNS, speed, content, and visual changes, ensuring that your pages are not just reachable but also look and perform as expected for visitors. Key Features: Visual Regression Detection: Screenshots pages and detects pixel-level visual changes, catching UI regressions or defacements. Multi-Layer Monitoring: Monitors uptime, SSL/TLS certificates (30 days out), DNS records, and content changes (text diff). Performance Tracking: Tracks Core Web Vitals (LCP, FCP, CLS, TTFB) and response trends over time, integrating with PageSpeed scores. AI-Assisted Incident Management: Generates plain-English incident summaries, one-click postmortems, and status update drafts, with auto-resolve functionality. Integrated Infrastructure Monitoring: Correlates website issues with server metrics (CPU, memory, disk) and Cloudflare zones for root cause analysis. Extensive Alert Channels: Supports 10+ notification channels including Slack, WhatsApp, PagerDuty, Email, and Web Push, with per-monitor routing and quiet hours. Use Cases: Visual Sentinel is ideal for operators, e-commerce businesses, SaaS companies, and agencies who need to ensure their online presence is always optimal. For e-commerce sites, it proactively identifies broken checkout pages, missing product images, or layout shifts caused by updates, preventing revenue loss. SaaS and app developers can catch CSS breaks, slow pages, or layout shifts in production immediately after a deploy, minimizing user impact and support tickets. Agencies benefit from monitoring multiple client sites from a single dashboard, with per-client alert routing and white-label status pages, providing concrete evidence of issues and their resolution. Beyond these, it's crucial for any business to detect critical issues like expired SSL certificates, DNS record changes (potential hijacking), or unexpected content alterations before they affect user trust or search engine rankings. Pricing Information: Visual Sentinel operates on a freemium model. A permanent Free plan offers 3 monitors with uptime and SSL checks every 10 minutes. Users can opt for a 7-day no-card Business trial during initial setup. Paid plans start at $6/month for Solo users, scaling up through Starter, Business, and Agency tiers, offering more monitors, faster check intervals (down to 1 minute), and advanced features like white-label status pages and team seats. User Experience and Support: The platform features a clean, intuitive dashboard that centralizes all monitoring data. Its AI-assisted incident management streamlines the process of understanding, communicating, and resolving issues, making it user-friendly even during high-stress situations. Support is available via email, and the platform provides comprehensive documentation and guides, including comparisons with other monitoring tools. Technical Details: Visual Sentinel offers a public REST API with an OpenAPI 3.1 specification, allowing for custom integrations and client generation in various languages. It includes an MCP (Model Context Protocol) server and Claude Skills for AI-native interaction, enabling users to query monitor data and manage incidents through AI assistants. API monitoring supports multi-step probes and JSON-path assertions for robust endpoint validation. Integrations with Google Analytics, Search Console, Cloudflare, and server agents provide deep contextual insights. Pros: Comprehensive monitoring beyond basic uptime (visual, content, performance, security). AI-powered incident management for faster resolution and communication. Deep integration with infrastructure (servers, Cloudflare) for root cause analysis. Flexible and extensive alert channels, including native WhatsApp integration. Detailed historical data and visual comparison tools. Freemium model with a generous free plan. Cons: Advanced features might have a slight learning curve for new users. No explicit mention of self-hosting options. No direct mention of mobile apps for monitoring, primarily web-based dashboard. Conclusion: Visual Sentinel stands out as a powerful, multi-faceted monitoring solution that ensures your website's integrity from every angle. By combining traditional checks with advanced visual and content monitoring, it empowers teams to proactively identify and resolve issues before they impact users or revenue. Start monitoring free today to experience a new level of website vigilance.
MPulse CMMS is a powerful, scalable computerized maintenance management system designed to boost operational efficiency, reduce equipment downtime, and streamline facility maintenance workflows. This cloud-based platform supports preventive maintenance, asset tracking, work order automation, and real-time performance monitoring, making it ideal for organizations from small startups to global enterprises across manufacturing, facilities, healthcare, and government sectors.Key Features:Work Order Management: Centralize, prioritize, assign, and track maintenance requests in real-time.PM Scheduling & Tracking: Automate preventive maintenance based on time, meter readings, or condition triggers.Parts and Supplies Inventory Management: Track inventory, set reorder points, and manage purchase requisitions.Graphical Reporting & Analytics: Generate custom dashboards and reports for key performance indicators.Adaptive Any Device Interface: Access and update work orders from desktops, tablets, or smartphones, with offline capabilities.Real-Time Monitoring & IIoT DataLink Integration: Exchange real-time data with other systems and sensors out of the box.Use Cases:MPulse CMMS is invaluable for industries requiring robust maintenance solutions. Manufacturing facilities can keep production flowing and reduce downtime by proactively managing equipment. Healthcare and government organizations can streamline regulatory audits, adhere to compliance standards (OSHA, FDA, EPA), and efficiently manage assets and work orders. Facilities teams, including those managing HVAC, plumbing, electrical, or fleet operations, can simplify maintenance across multiple sites, extending asset life and reducing unplanned downtime.The software offers flexible deployment options, allowing users to subscribe annually or own the software outright, with free hosting available. Prospective users can explore the platform through a Free Demo or by trying it for Free.User Experience and Support:MPulse provides an intuitive, easy-to-use interface that adapts to any device. The company is dedicated to customer success, offering unlimited phone and email support, online workshops, onsite consulting, and live training sessions through MPulse Fundamentals. A robust support portal, quarterly Academies, and annual User Conferences further enhance the user experience and provide continuous learning opportunities.Technical Details:Built on robust Microsoft .NET technology, MPulse CMMS ensures high performance and ease of integration. It offers flexible deployment options, including cloud-based or on-premises hosting, catering to organizations with strict data sovereignty or HIPAA requirements. The exclusive MPulse DataLink Integration Adapter allows effortless connection with other systems and sensors for real-time data exchange.Pros:Scalable for diverse organizational sizes and needs.Significantly reduces maintenance costs and equipment downtime.Extends asset lifespan and boosts overall productivity.Comprehensive compliance support for various industry regulations.Flexible deployment options (cloud or on-premise).Cons:May require initial training to fully leverage advanced features.No explicit mention of a public API for custom integrations beyond DataLink.Conclusion:MPulse CMMS stands out as a comprehensive, reliable, and user-friendly solution for modern maintenance management. Its advanced features, flexible deployment, and dedicated support empower teams to optimize operations, achieve compliance, and make data-driven decisions. Request a Live Demo or Try for Free to discover the true power of MPulse.
URL Not Found represents a fundamental web server response, specifically the HTTP 404 status code, indicating that the requested resource could not be located on the server. This essential 'service' is critical for web infrastructure, signaling to both users and automated systems when a specific web page, file, or API endpoint is inaccessible.The primary purpose is to clearly communicate the absence of a requested resource, preventing users from encountering broken or non-existent content. It targets web developers, system administrators, and end-users who encounter broken links or misconfigured web services, providing a standardized way to handle resource unavailability.Key FeaturesStandard HTTP 404 response code for resource absence.Clear indication of unavailable web content.Prevents access to non-existent or deleted information.Essential for maintaining web security and data integrity.Customizable error pages for consistent branding and user guidance.Use CasesDebugging Web Applications: Developers heavily rely on 404 responses to identify and rectify broken internal links, incorrect API endpoints, or missing assets during the development and testing phases. This helps in ensuring a robust, error-free application and a smooth user experience.User Experience Management: When an end-user clicks on an outdated, mistyped, or moved link, a well-designed "URL Not Found" page informs them clearly about the issue. These pages often provide navigation options back to the main site, search functionality, or suggestions for related content, thereby reducing user frustration and improving overall site usability.SEO and Site Maintenance: Search engines interpret 404 errors, which can significantly impact a website's indexing and search ranking. Monitoring these errors is vital for SEO professionals and site owners, enabling them to fix broken links, implement proper redirects (e.g., 301 redirects for moved content), and maintain a healthy, crawlable website structure.Pricing InformationThe "URL Not Found" response is an inherent and fundamental component of the HTTP protocol and web server functionality. It is typically included as part of any web hosting package or server infrastructure, meaning there are no direct costs associated with the 404 response itself. It's a foundational aspect of how the internet operates.User Experience and SupportThe user experience for a "URL Not Found" situation is straightforward: a message indicating the page is not found, often accompanied by a custom error page designed by the website owner. Support for managing and configuring these responses is typically found within the documentation of web servers (e.g., Apache, Nginx, IIS) or through the technical support channels of web hosting providers. Resources focus on how to create custom error pages, troubleshoot missing files, and implement redirects.Technical DetailsThe "URL Not Found" response is primarily governed by the Hypertext Transfer Protocol (HTTP), specifically the 404 status code. It is implemented by virtually all web servers (such as Apache HTTP Server, Nginx, Microsoft IIS) and various application frameworks (e.g., Node.js with Express, Python with Django/Flask, Ruby on Rails) that handle URL routing and resource resolution. The server checks if a requested resource exists; if not, it returns the 404 status along with an optional error page.Pros and ConsPros:Provides clear and standardized communication of resource absence.Aids significantly in debugging web applications and site maintenance.Enhances security by not revealing internal server errors or directory structures.Customizable error pages allow for consistent branding and user guidance.Standardized across the entire World Wide Web.Cons:Frequent 404 errors can indicate poor site maintenance or broken links.May lead to user frustration if not handled gracefully with helpful alternatives.Requires active monitoring to prevent negative impacts on SEO and user trust.The error message itself doesn't provide specific reasons for the resource's absence.ConclusionThe "URL Not Found" response is an indispensable and ubiquitous component of the internet, serving as a critical signal for both human users and automated systems regarding inaccessible web resources. Effectively understanding, managing, and customizing these responses is paramount for maintaining a healthy, user-friendly, and SEO-optimized online presence. We encourage exploring web server documentation and best practices to handle 404 errors gracefully.
ScrapX is an agentic website monitoring and competitor intelligence service designed to keep businesses informed about real-time changes on any website without requiring any coding. It caters to product builders, marketers, sales teams, and analysts who need to track competitor moves, monitor their own site's performance, or gather strategic insights efficiently. Key Features: Visual Detection: Track pixel-by-pixel changes for design tweaks, ad banners, or UI bugs. Textual Detection: Monitor specific text elements using AI prompts or precise CSS selectors. Data Extraction: Transform unstructured web pages into clean, usable structured data like prices, names, and stock status. Scraper API: Scrape any JavaScript-rendered website via a plain-text prompt, returning screenshots, raw HTML, or data extracts in one API call. Real-time Alerts: Receive instant notifications via email or custom webhooks when changes are detected. Multi-user Access: Facilitates team collaboration for shared insights across departments. Use Cases: ScrapX excels in competitor monitoring, providing real-time insights into product launches, pricing adjustments, promotions, and content strategy. This allows businesses to anticipate market shifts and adapt quickly. It's also invaluable for internal website monitoring, ensuring design consistency, tracking content updates, and identifying UI issues. Beyond competitive analysis, ScrapX helps monitor website uptime and performance, including SSL certificate expiry and subdomain changes, crucial for security and SEO. Professionals like German tax advisors can leverage it to automate tracking of regulatory updates on government websites, saving significant manual effort. Pricing Information: ScrapX offers a flexible pricing model starting with a generous free tier. Paid plans include Starter at $9/month, Pro at $29/month, and Scale at $99/month, with an option for annual billing to save 25%. The free plan includes 20 API requests/day, 5 monitored URLs, and 2 competitors, making it accessible for initial exploration. User Experience and Support: Designed for ease of use, ScrapX requires no installation or technical configuration; it runs entirely in the cloud. Users simply log in, add a URL, and select what to monitor. The platform provides chat support and dedicated support for paid plans, ensuring users can get assistance when needed. Technical Details: The service leverages AI for intelligent text detection and data extraction, simplifying complex scraping tasks. Its Scraper API is capable of handling JavaScript-rendered websites, providing robust capabilities for modern web applications. The entire system is cloud-based, ensuring accessibility and scalability. Pros and Cons: Pros: No coding required for powerful website monitoring. AI-powered visual, textual, and data extraction capabilities. Real-time alerts via email and webhooks. Dedicated Scraper API for advanced use cases. Strong focus on competitor intelligence. Free tier available to start. Multi-user support for teams. Cons: Higher monitoring frequencies are plan-dependent. No specific cons mentioned in the provided text, implying a smooth user experience. Conclusion: ScrapX provides a powerful, no-code solution for real-time website monitoring and competitive intelligence, empowering businesses to stay ahead in fast-moving markets. Its blend of visual, textual, and data extraction capabilities, coupled with an intuitive interface and flexible API, makes it an essential tool for strategic insights. Explore ScrapX today to transform website changes into actionable intelligence.

ServiceStatus is a robust SaaS solution designed to proactively manage and mitigate service interruptions, ensuring high availability for your applications. It helps businesses maintain continuous operation by intelligently handling temporary server errors and service unavailability.Target Audience: This service is ideal for developers, operations teams, and businesses of all sizes that rely on critical online services and APIs, aiming to minimize downtime and enhance user experience.Key FeaturesReal-time Uptime Monitoring: Continuously tracks the availability and responsiveness of your services and APIs.Automated Retry Logic: Implements intelligent retry mechanisms to overcome transient server errors without manual intervention.Incident Alerting & Notifications: Provides instant alerts via multiple channels (email, SMS, Slack) upon service degradation or failure.Performance Analytics & Reporting: Offers detailed insights into service performance, error rates, and uptime history.Scalable & Resilient Infrastructure: Built on a cloud-native architecture to ensure its own high availability and performance.Use CasesImagine an e-commerce platform experiencing a temporary hiccup with its payment gateway API. Instead of failing the transaction outright, ServiceStatus can automatically reattempt the payment after a short delay, ensuring a seamless customer experience and preventing lost sales. This proactive approach significantly reduces customer frustration and protects revenue streams.Another scenario involves a microservices architecture where one service might occasionally become unresponsive. ServiceStatus can detect this, queue requests, and retry them once the service recovers, maintaining the overall integrity and functionality of the application. It acts as a crucial layer of resilience, allowing development teams to focus on innovation rather than constant firefighting.Pricing InformationServiceStatus offers a flexible freemium model, allowing users to get started with basic monitoring capabilities at no cost. Paid plans are subscription-based, scaling with the number of services monitored and advanced features required, such as extended data retention and priority support. A 14-day free trial is available for all premium tiers.User Experience and SupportThe platform boasts an intuitive, user-friendly dashboard that provides a clear overview of all monitored services. Configuration is straightforward, with comprehensive documentation and step-by-step tutorials available. Our dedicated support team is accessible via email and live chat, ensuring prompt assistance for any queries or issues.Technical DetailsBuilt using modern web technologies, ServiceStatus leverages a robust cloud infrastructure for high scalability and reliability. It utilizes RESTful APIs for seamless integration with existing systems and supports various monitoring protocols. The backend is likely powered by languages like Node.js or Go, with a frontend built using React or Vue.js.Pros and ConsPros: Increased service uptime and reliability; Automated error handling reduces manual intervention; Improved user experience; Comprehensive monitoring and analytics; Scalable and easy to integrate.Cons: Initial configuration might require some technical understanding; Dependency on an external service for critical operations; Advanced features are behind a paywall.ConclusionServiceStatus is an essential tool for any organization prioritizing service reliability and a superior user experience. By automating the detection and handling of transient service errors, it empowers businesses to deliver consistent performance and build trust with their users. Explore ServiceStatus today to fortify your application's resilience and ensure continuous operation.
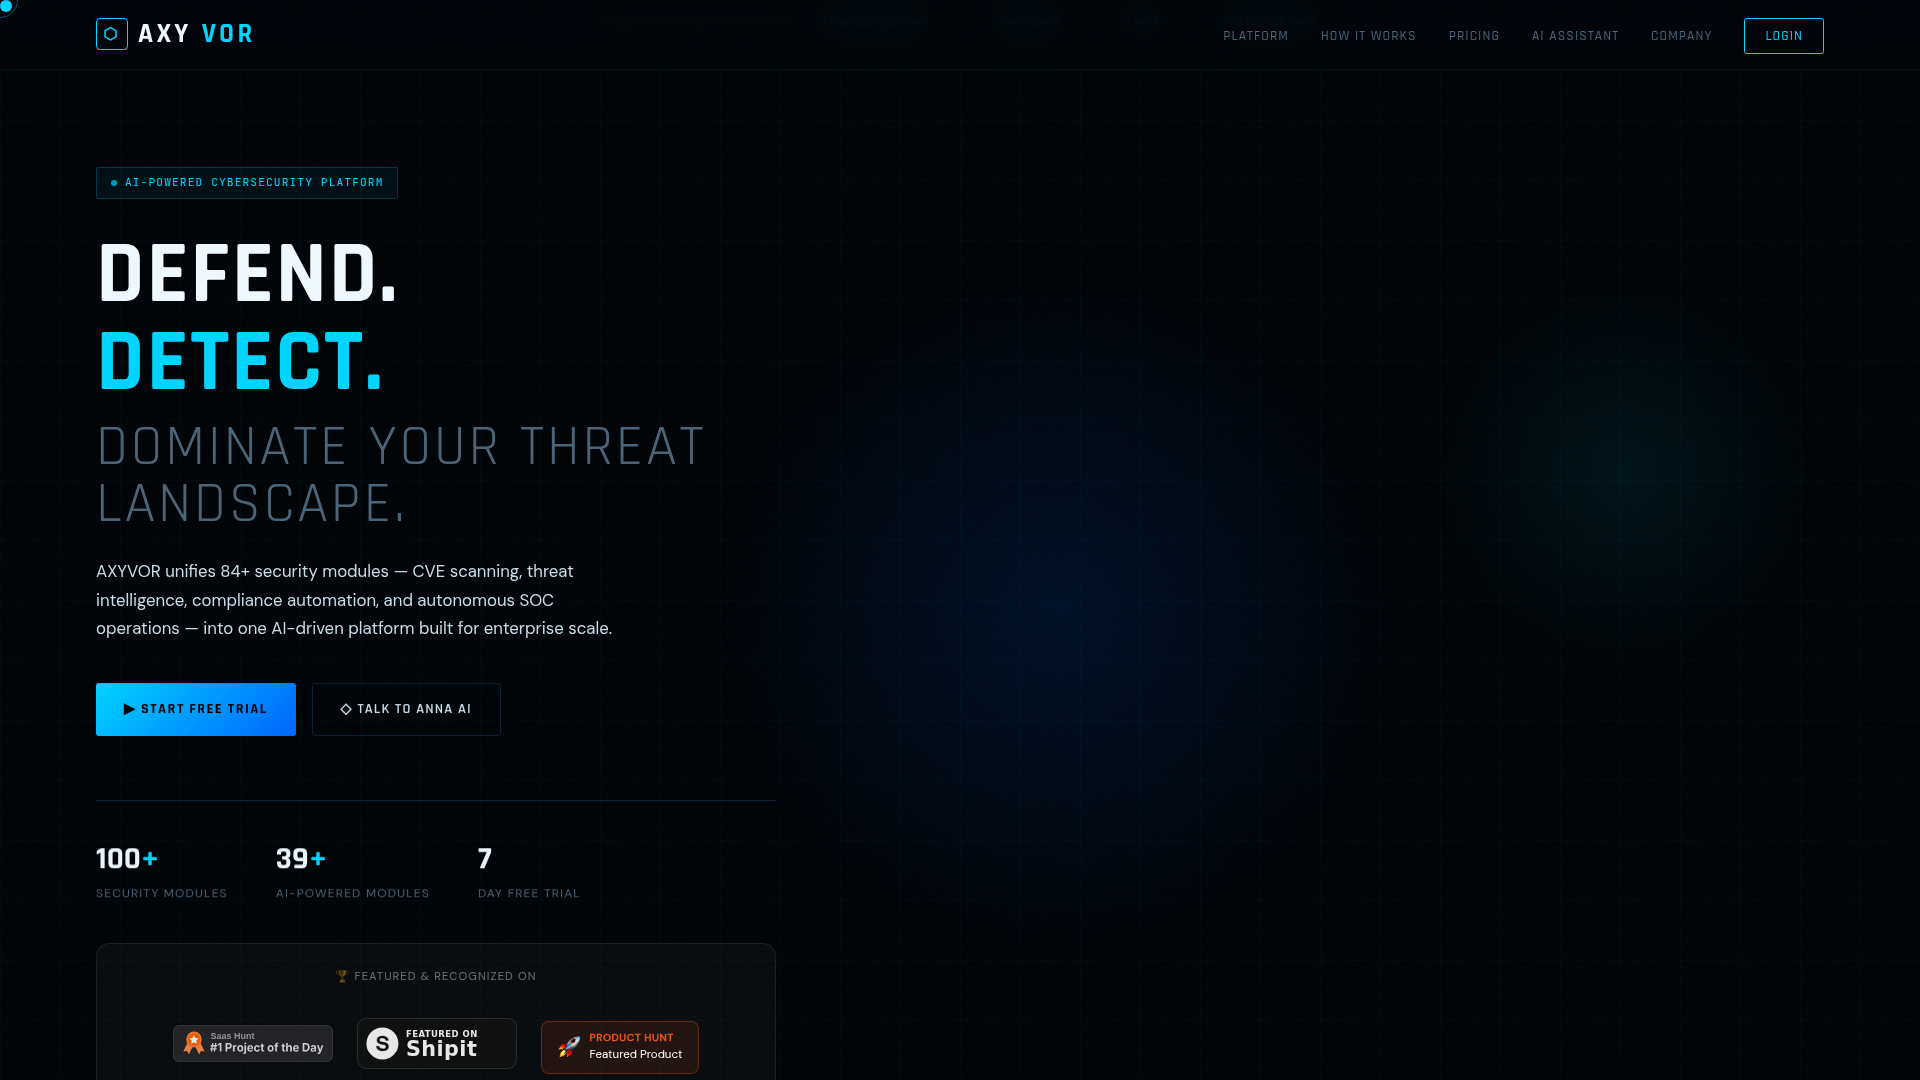
AXYVOR is an advanced AI-powered cybersecurity platform designed to unify and automate enterprise-grade security operations. It serves as a comprehensive solution for defending, detecting, and dominating the modern threat landscape, targeting security teams in Financial Services, Healthcare, Legal, and Enterprise Tech sectors, as well as growing SMBs. Key Features Unified Security Platform: Integrates 84+ security modules, including CVE scanning, threat intelligence, compliance automation, and autonomous SOC operations. AI-Driven Automation: Leverages Claude AI for threat engine initialization, remediation plan generation, and 24/7 autonomous SOC operations. Real-time Vulnerability Management: Conducts real-time CVE scanning against NIST NVD, CISA KEV, and EPSS scoring to identify exposures proactively. Comprehensive Attack Surface Mapping: Utilizes Shodan for external exposure mapping, discovering shadow IT, open ports, and misconfigured cloud assets. Automated Compliance: Streamlines evidence collection for SOC2, PCI-DSS, ISO27001, and HIPAA, generating audit-ready reports in seconds. Proactive Threat Simulation: Features Red Team AI for simulated adversarial attacks and Dark Web monitoring for leaked credentials. Use Cases AXYVOR addresses critical challenges faced by modern security teams, such as alert fatigue, slow breach detection, and the high cost of security incidents. By unifying over 84 modules into a single AI-driven platform, it provides unprecedented visibility and control, allowing organizations to move from reactive to proactive defense strategies. For instance, security teams can leverage its autonomous SOC to handle incident triage and response 24/7 without analyst burnout, significantly reducing the average 277 days it takes to detect a breach. The platform is invaluable for organizations needing to maintain stringent regulatory compliance. Its Compliance AI module automates evidence collection for frameworks like SOC2, PCI-DSS, ISO27001, and HIPAA, drastically cutting down audit preparation time. Furthermore, the Red Team AI and Dark Web Monitor enable companies to continuously test their defenses against simulated attacks and monitor for leaked credentials, ensuring they are prepared for real-world threats and protecting against the average $4.9M cost of a data breach. Pricing Information AXYVOR operates on a paid subscription model with a transparent pricing structure. It offers a 7-day free trial with no credit card required. The "Starter" plan is available at $2,500/month for SMBs, while the "Enterprise" plan, offering full platform capabilities, is priced at $12,000/month. A "Sovereign" custom plan is also available for critical sectors requiring dedicated infrastructure. User Experience and Support Onboarding with AXYVOR is designed to be quick and intuitive, guided by an AI wizard that connects cloud environments, endpoints, and SaaS tools in minutes. The platform features Anna, an AI security assistant powered by Claude AI, available 24/7 to answer questions, provide platform guidance, and assist with scheduling demos. This ensures users have immediate access to support and information, enhancing ease of use and reducing the learning curve. Technical Details AXYVOR is built as an AI-powered platform, leveraging advanced AI models like Claude AI for its core functionalities, including threat intelligence correlation, remediation planning, and autonomous SOC operations. It integrates with industry-standard security data sources such as NIST NVD and CISA KEV for vulnerability management, and Shodan for attack surface mapping. The platform supports multi-cloud security posture management for major providers like AWS, Azure, and GCP, ensuring comprehensive coverage across diverse IT environments. Pros and Cons Pros: Unifies 84+ security modules into a single platform, reducing complexity. AI-driven automation significantly enhances detection, response, and compliance. Comprehensive coverage from CVE scanning to autonomous SOC and dark web monitoring. Proactive defense capabilities with Red Team AI and real-time threat intelligence. Automated compliance evidence collection saves time and resources. Dedicated AI assistant (Anna) provides 24/7 support and guidance. Cons: Enterprise-level pricing may be a barrier for very small businesses. Extensive feature set (84+ modules) might have a learning curve for new users. No explicit mention of custom integration capabilities for the Starter plan. Relies heavily on AI, which might require trust in AI-driven decisions. Conclusion AXYVOR stands out as a robust, AI-powered cybersecurity platform that offers unparalleled unification and automation for enterprise security. By consolidating critical security functions and leveraging advanced AI, it empowers organizations to effectively defend against evolving threats, streamline compliance, and significantly reduce breach risks. Explore AXYVOR's capabilities today by starting a free 7-day trial and transform your security posture.

Prilog is a cutting-edge self-healing software designed to revolutionize how engineering teams manage production issues. It eliminates the tedious process of triaging bugs by automatically mapping incidents to exact code paths and drafting review-ready fixes, significantly cutting Mean Time To Resolution (MTTR) by up to 90%. This powerful SaaS is ideal for development teams and SREs looking to streamline their incident response, reduce debugging hours, and transform recurring production issues into actionable, human-approved pull requests. Key Features Automated Incident Mapping: Ingests logs and traces from popular platforms like Datadog, SigNoz, AWS, GCP, and Azure, correlating them to your codebase in GitHub or GitLab. AI-Powered Fix Generation: Leverages advanced AI (OpenAI, Anthropic, Ollama) to draft review-ready code fixes with context and rationale. Workflow Integration: Seamlessly routes follow-up tasks to existing project management tools such as Jira, Linear, or GitHub Issues. Production Remediation Graph: A unique memory system that learns from past incidents, code changes, reviews, and successful remediations to continuously improve fix accuracy and speed. Human-Approved Control: Every generated fix remains reviewable, allowing your team to maintain full control and decide whether to open a PR or route to the backlog. Significant MTTR Reduction: Transforms hours of debugging into minutes of fix review, leading to up to 90% lower MTTR. Use Cases Prilog excels in environments where recurring production issues consume significant engineering time. Instead of engineers spending countless hours sifting through logs and debugging, Prilog automates the initial diagnostic and remediation steps. For instance, a "503 gateway timeout spike" detected in your payments-api service would be automatically mapped to the specific code causing the issue, and a proposed fix would be drafted, ready for a developer's quick review and approval. It's particularly beneficial for teams aiming to shift their focus from reactive firefighting to proactive code improvement. By turning noisy alerts into drafted fixes, Prilog enables teams to address root causes more efficiently, ensuring that every approved fix contributes to a more resilient system over time. This allows developers to concentrate on shipping new features rather than being bogged down by repetitive bug resolution. Pricing Information Prilog offers a usage-based pricing model, starting with a 7-day free trial that includes 3 fixes and 1 project, with no credit card required. After the trial, users can choose from Starter ($249/month + per fix), Professional ($799/month + per fix), or custom Enterprise plans. The pricing is designed to reflect the value delivered, with an emphasis on estimated monthly savings by reducing manual engineering effort and outage exposure. User Experience and Support Prilog is built for seamless integration into existing developer workflows. It connects once to your production logs, code repositories, and task management tools, then operates in the background to surface issues and draft fixes. The emphasis is on providing review-ready PRs, ensuring that the human element of approval and judgment remains central. Support options include email for Starter plans, email and Slack for Professional, and custom support for Enterprise clients, ensuring teams have the assistance they need. Technical Details The core of Prilog's intelligence lies in its "Issue-to-PR engine," which combines advanced AI models like OpenAI, Anthropic, and Ollama with a proprietary memory graph. This graph intelligently correlates incidents, code, reviews, and fixes across services and deployments. It integrates with a wide array of telemetry sources (Datadog, AWS CloudWatch, OpenTelemetry, etc.), code platforms (GitHub, GitLab), and task management systems (Jira, Linear), making it highly adaptable to diverse tech stacks. Pros and Cons Pros: Drastically reduces MTTR and debugging time. Automates the generation of review-ready code fixes. Integrates deeply with existing developer tools and workflows. Learns and improves over time through its "Production Remediation Graph." Maintains human oversight with mandatory fix approval. Strong enterprise-grade security and data privacy features. Cons: Requires initial setup and integration with existing stack. Reliance on AI for fix generation, though human-approved. Pricing scales with usage, which might need careful monitoring for cost optimization. Potential learning curve for adopting a new automated remediation workflow. Conclusion Prilog offers a transformative approach to incident management, turning the reactive process of bug fixing into a proactive, self-healing system. By automating the detection, mapping, and drafting of fixes, it empowers engineering teams to focus on innovation rather than endless debugging. Explore Prilog today to clear your bugs faster and build more resilient software.